Study on the perception of pet tech
Do connected products for pets win owners’ approval?
Do connected products for pets win owners’ approval?
The Weenect survey analyzes the uses and representations of pet tech among dog and cat owners. It sought to answer several key questions: which features are considered the most useful? Do users prioritize versatility or specialization? What are their main motivations and what barriers could discourage them? Finally, how do these preferences vary depending on the respondents’ profiles?
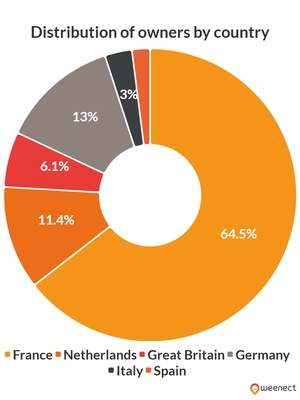
To obtain a complete and accurate vision, the survey relied on a poll of 1,928 respondents, including dog and cat owners, mostly living in rural and peri-urban areas in France, Spain, the United Kingdom, Italy, the Netherlands, and Germany. Participants provided detailed information about their use and expectations of connected products for pets, their perceptions of technology, as well as their priorities in terms of features and budget.
This approach provided a clear picture of the behaviors, motivations, and barriers of pet owners when facing technological innovations, offering valuable data to understand the levers and obstacles to adopting connected solutions.
Discover the main insights from the survey through detailed findings, illustrated with charts and data visuals.
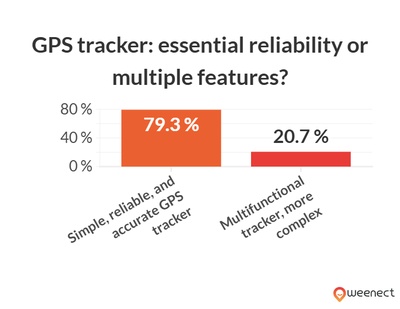
79.3% of respondents (1,529) prefer a simple and reliable GPS tracker over a multifunctional model. This preference is similar among dog owners (78.5%) and cat owners (80.1%). People over 45 represent the majority in this sample (58%), showing that practicality outweighs unnecessary innovation.
75.3% prefer one reliable function to an "all-in-one" product. Respondents mainly fear complexity and multiple failures. This reflects a clear need: a tool focused on one essential mission, without distraction or technological overload.
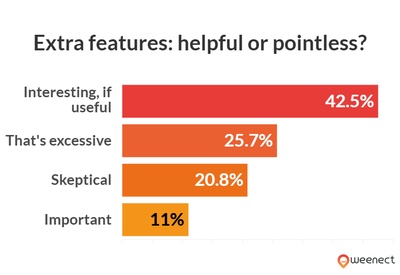
42.5% consider health functions useful only if they meet a concrete need, 25.7% believe it goes too far, and 20.8% see it as marketing. People aged 24–34 are more favorable than those over 55, who prefer to rely on veterinarians.
59.5% fear a false diagnosis and 39% are concerned about data protection. Older respondents are more distrustful. With only 48.8% average trust, transparency and education about usage are key to removing these barriers.
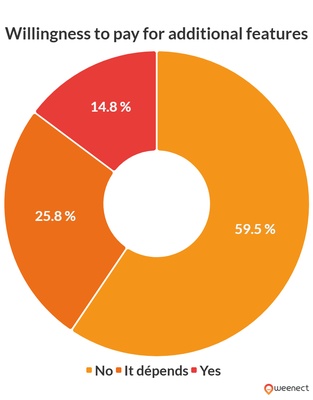
59.5% (1,147 respondents) refuse to pay more for additional functions. Only 14.8% would agree if the added value is real. People aged 55 and above are the most sensitive to budget constraints.
Respondents in rural and peri-urban areas (81.7% of the sample) show stronger resistance to price increases. Young urban residents are more inclined to invest if the product precisely meets their needs.
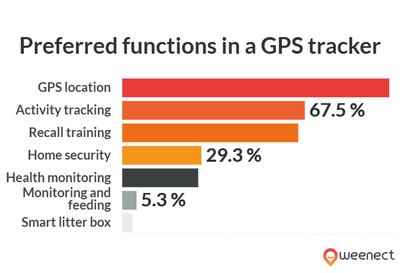
98.7% value real-time GPS location, followed by activity tracking (67.5%) and recall training (65.1%). GPS location remains the core demand, across all categories.
Dog owners place greater value on recall training (+8.8 pts) and activity tracking (+4.9 pts). Cat owners prioritize home control (+10.1 pts) and connected litter boxes (+5.9 pts). This shows that depending on the pet, owners give different importance to different features
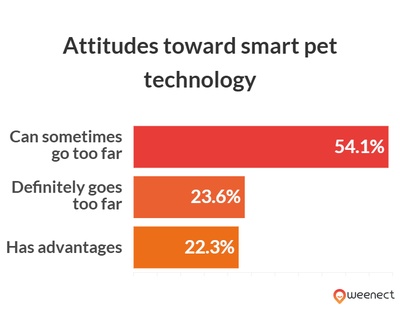
54.1% believe technology can go too far depending on the case, 23.6% think it clearly does, and 22.3% always consider it beneficial. Younger respondents are more favorable than seniors.
59% want to know exactly what data is collected. Trust in a technological tool concerning data privacy remains fragile: 48.8% partially trust, 25.3% totally, and 25.2% not at all.
The survey shows that pet owners primarily want simple, specialised solutions that work reliably and offer fair value for money. GPS tracking stands out with nearly 99% approval as the undisputed top priority – safety and reliability are critical in an emergency. Additional features are only accepted if they provide a clear, everyday benefit; otherwise, concerns about data privacy, complexity and potential malfunctions prevail.
In the broader context, the study underlines a key point: the Pet Tech market is growing rapidly, but innovation must not become an end in itself. What truly matters is whether smart products genuinely make life easier for pets and their owners.
When it comes to purchasing decisions, reliability of tracking should be the top priority – ensured by strong antenna quality, precise location accuracy and short update intervals. Water resistance and device durability are also essential, while overly complex extra features can quickly become a distraction in daily life. Most pet owners therefore consciously choose fewer functions – but greater reliability and transparency.
To access the most relevant information, suitable payment methods, and delivery in your region, please select the website corresponding to your country.
